Performance Assessment

  • Description

    The VPIlinkConfigurator GUI offers two ways to validate the system performance. The Comparison view gives you the overall system performance results for all solutions, and the Interactive view provides a graphical way to analyze the configured WDM system through the use of signal metric maps displayed for a particular transmission line.

    The Comparison view showcases such key metrics as channel signal power, OSNR, and dispersion margins at the receiver points as well as the worst values of accumulated DGD, SPM, XPM, and FWM calculated for the whole system. Figure 1 shows the performance summary for one manual and two automatic solutions.

    In this view, a performance report for each optical channel or on a link-by-link basis can be displayed in a few clicks. Performance margins rescaled with respect to design rules constraints can also be displayed.

    Figure 2 and Figure 3 show a set of plots of system performance metrics as maps displayed for different transmission lines in the Interactive view.

  • Further Information

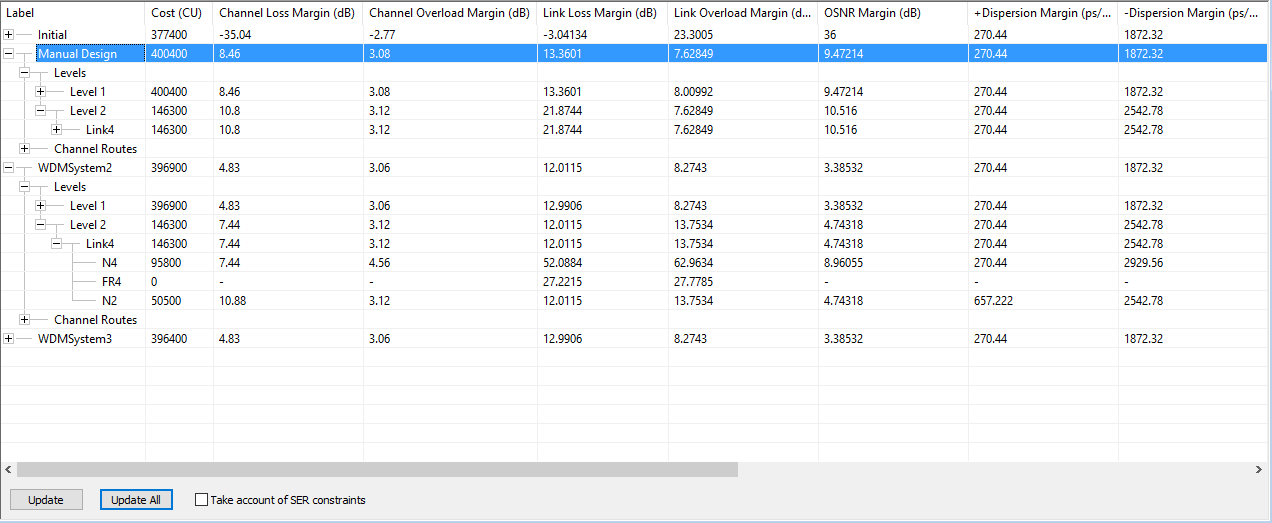
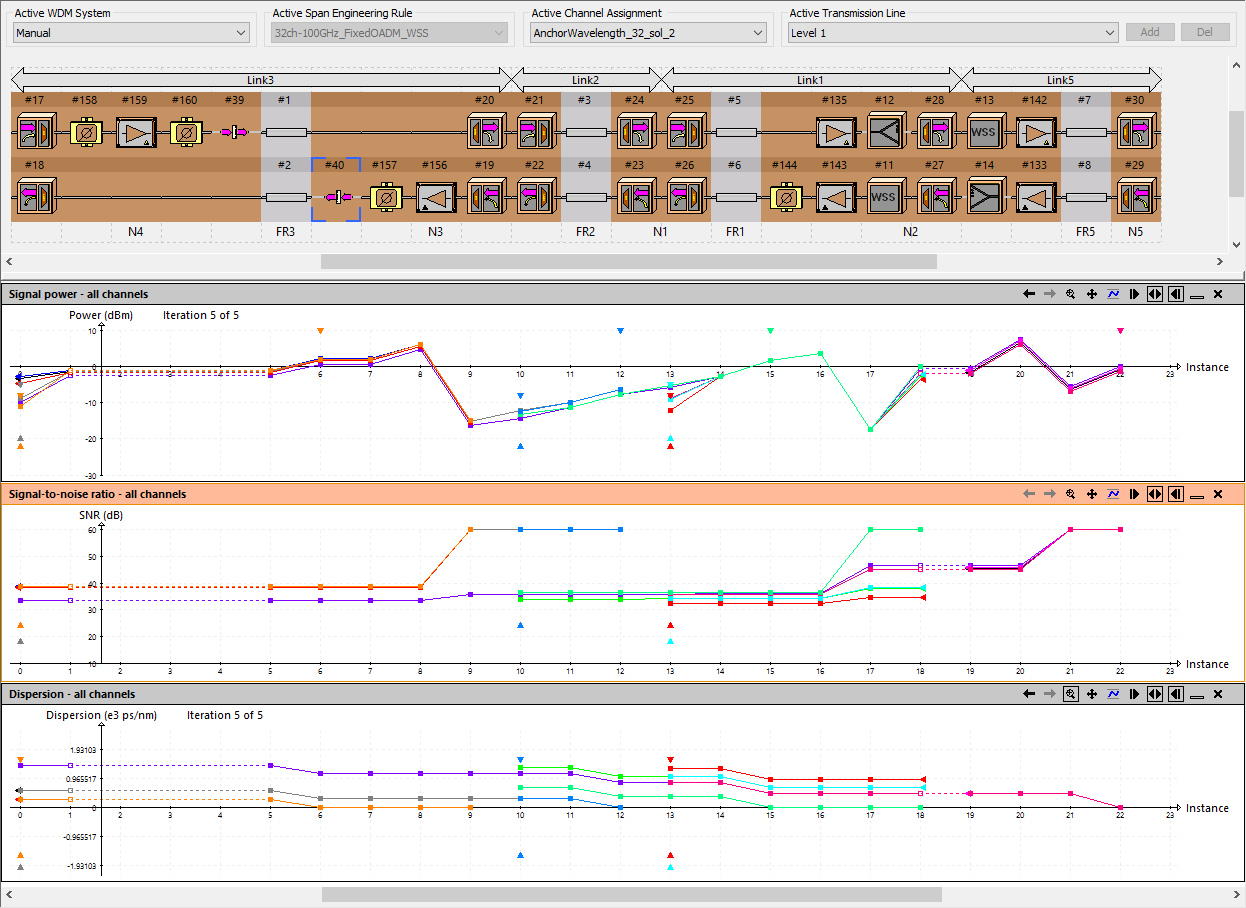
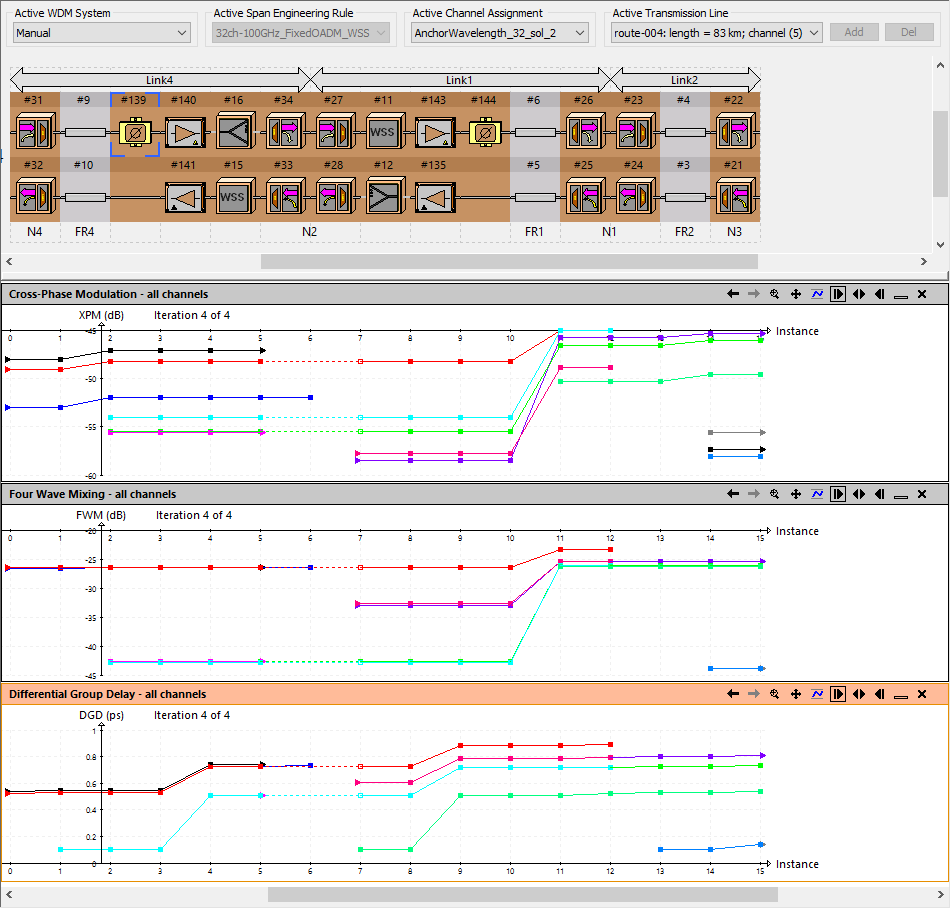
    Keywords: Optical System Performance, Optical Transmission Line, Link Loss Margin, Receiver Overload Margin, OSNR margin, Signal Power Map, Accumulated Dispersion Chart, FWM crosstalk, XPM Distortion, Accumulated DGD, DWDM Network Simulation.

    Similar demonstrations are available in the VPIlinkConfigurator Examples section.

« back to other examples